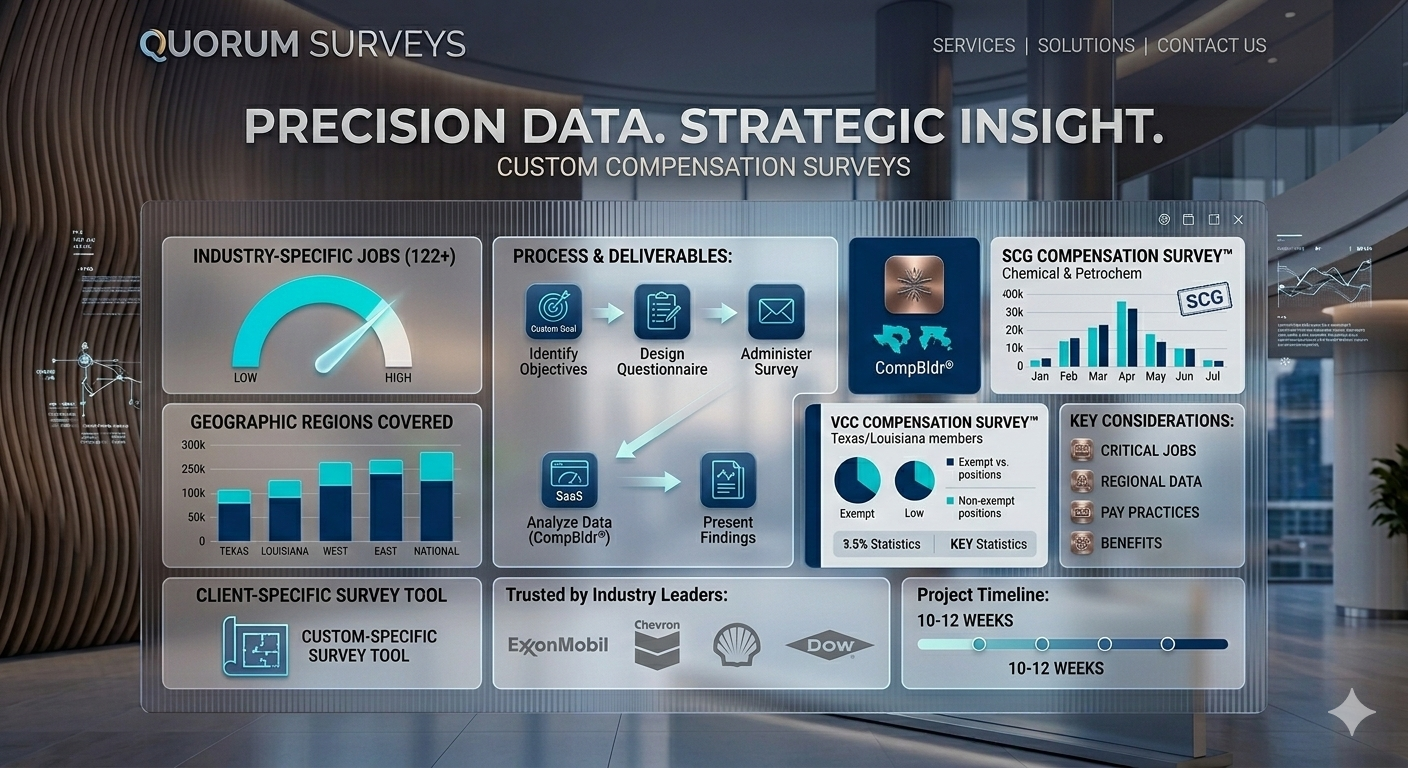
The VCC Compensation Survey™
Specifically designed for members of the Various Chemical Companies (VCC) located in Louisiana or Texas. No generic salary data, only peer-matched benchmarks from your actual competitive labor market.
Our Track Records
132
Positions Covered
3
Geographic Regions
99+
Exempt Positions
29
Non-Exempt Hourly
Purpose-Built for Louisiana & Texas Chemical Companies
The VCC Compensation Survey™ is a chemical/petrochemical industry survey specifically designed for members of the Various Chemical Companies (VCC) located in Louisiana or Texas. No generic salary data, onlypeer-matched benchmarks from your actual competitive labor market.
Request a Survey ProposalVCC Member Exclusive
Three Regional Breakouts
CompBldr® Powered Analysis
DOJ Safe Harbor Compliant
WHAT'S INCLUDED IN THE 2025 REPORT
This report delivers a comprehensive view of compensation across 132 positions, covering Exempt, Non-Exempt Salaried, and Hourly roles. It includes detailed regional breakdowns with union and non-union comparisons, along with VCC-specific data cuts for meaningful peer benchmarking.
What the Survey Measures
Comprehensive compensation data across every dimension relevant to chemical and petrochemical organizations in the VCC region.
Base Salary
Variable Pay & Incentives
Total Rewards
Geographic Segmentation
Union vs. Non-Union
Pay Equity Analysis
Job Families & Role Coverage
All positions benchmarked using the JESAP™ methodology via CompBldr® GradeBldr™ for objective, title-independent job valuing.
Exempt Positions
Non-Exempt Salaried
Field Operations Positions
Ready to Benchmark Your VCC Region Pay?
Download the 2025 report or speak with a Quorum compensation consultant.
LET’S TALK ABOUT PEOPLE, IDEAS, AND SOLUTIONS.
If you want to recruit, engage, develop, and retain the best team in the business, get in touch with us.
112 W. 34th Street 18th Floor
New York, NY 10120
6801 Pleasant Pines Drive, Suite 103
Raleigh, NC 27613
900 SE 5th Street Suite 22
Bentonville, AR 72712
8708 Technology Forest Place
Suite 175 PMB 1024
The Woodlands, TX 77381